What is Curves Anyway?
The Curves filter is one of the most powerful tonal adjustment tools in image editing. Popularized by Adobe Photoshop® and now present in nearly every photo editor, curves let you remap the image tonality, specified as a function from input level to output level.
Conceptually, you can think of curves like an audio equalizer but for images: each point along the horizontal axis represents an input brightness, and the vertical axis determines the new output brightness. By shaping the curve, you can emphasize detail in shadows, compress highlights, adjust midtones, or even produce stylized effects. Here are some screenshots captured from Pixelmator showing three different curves:
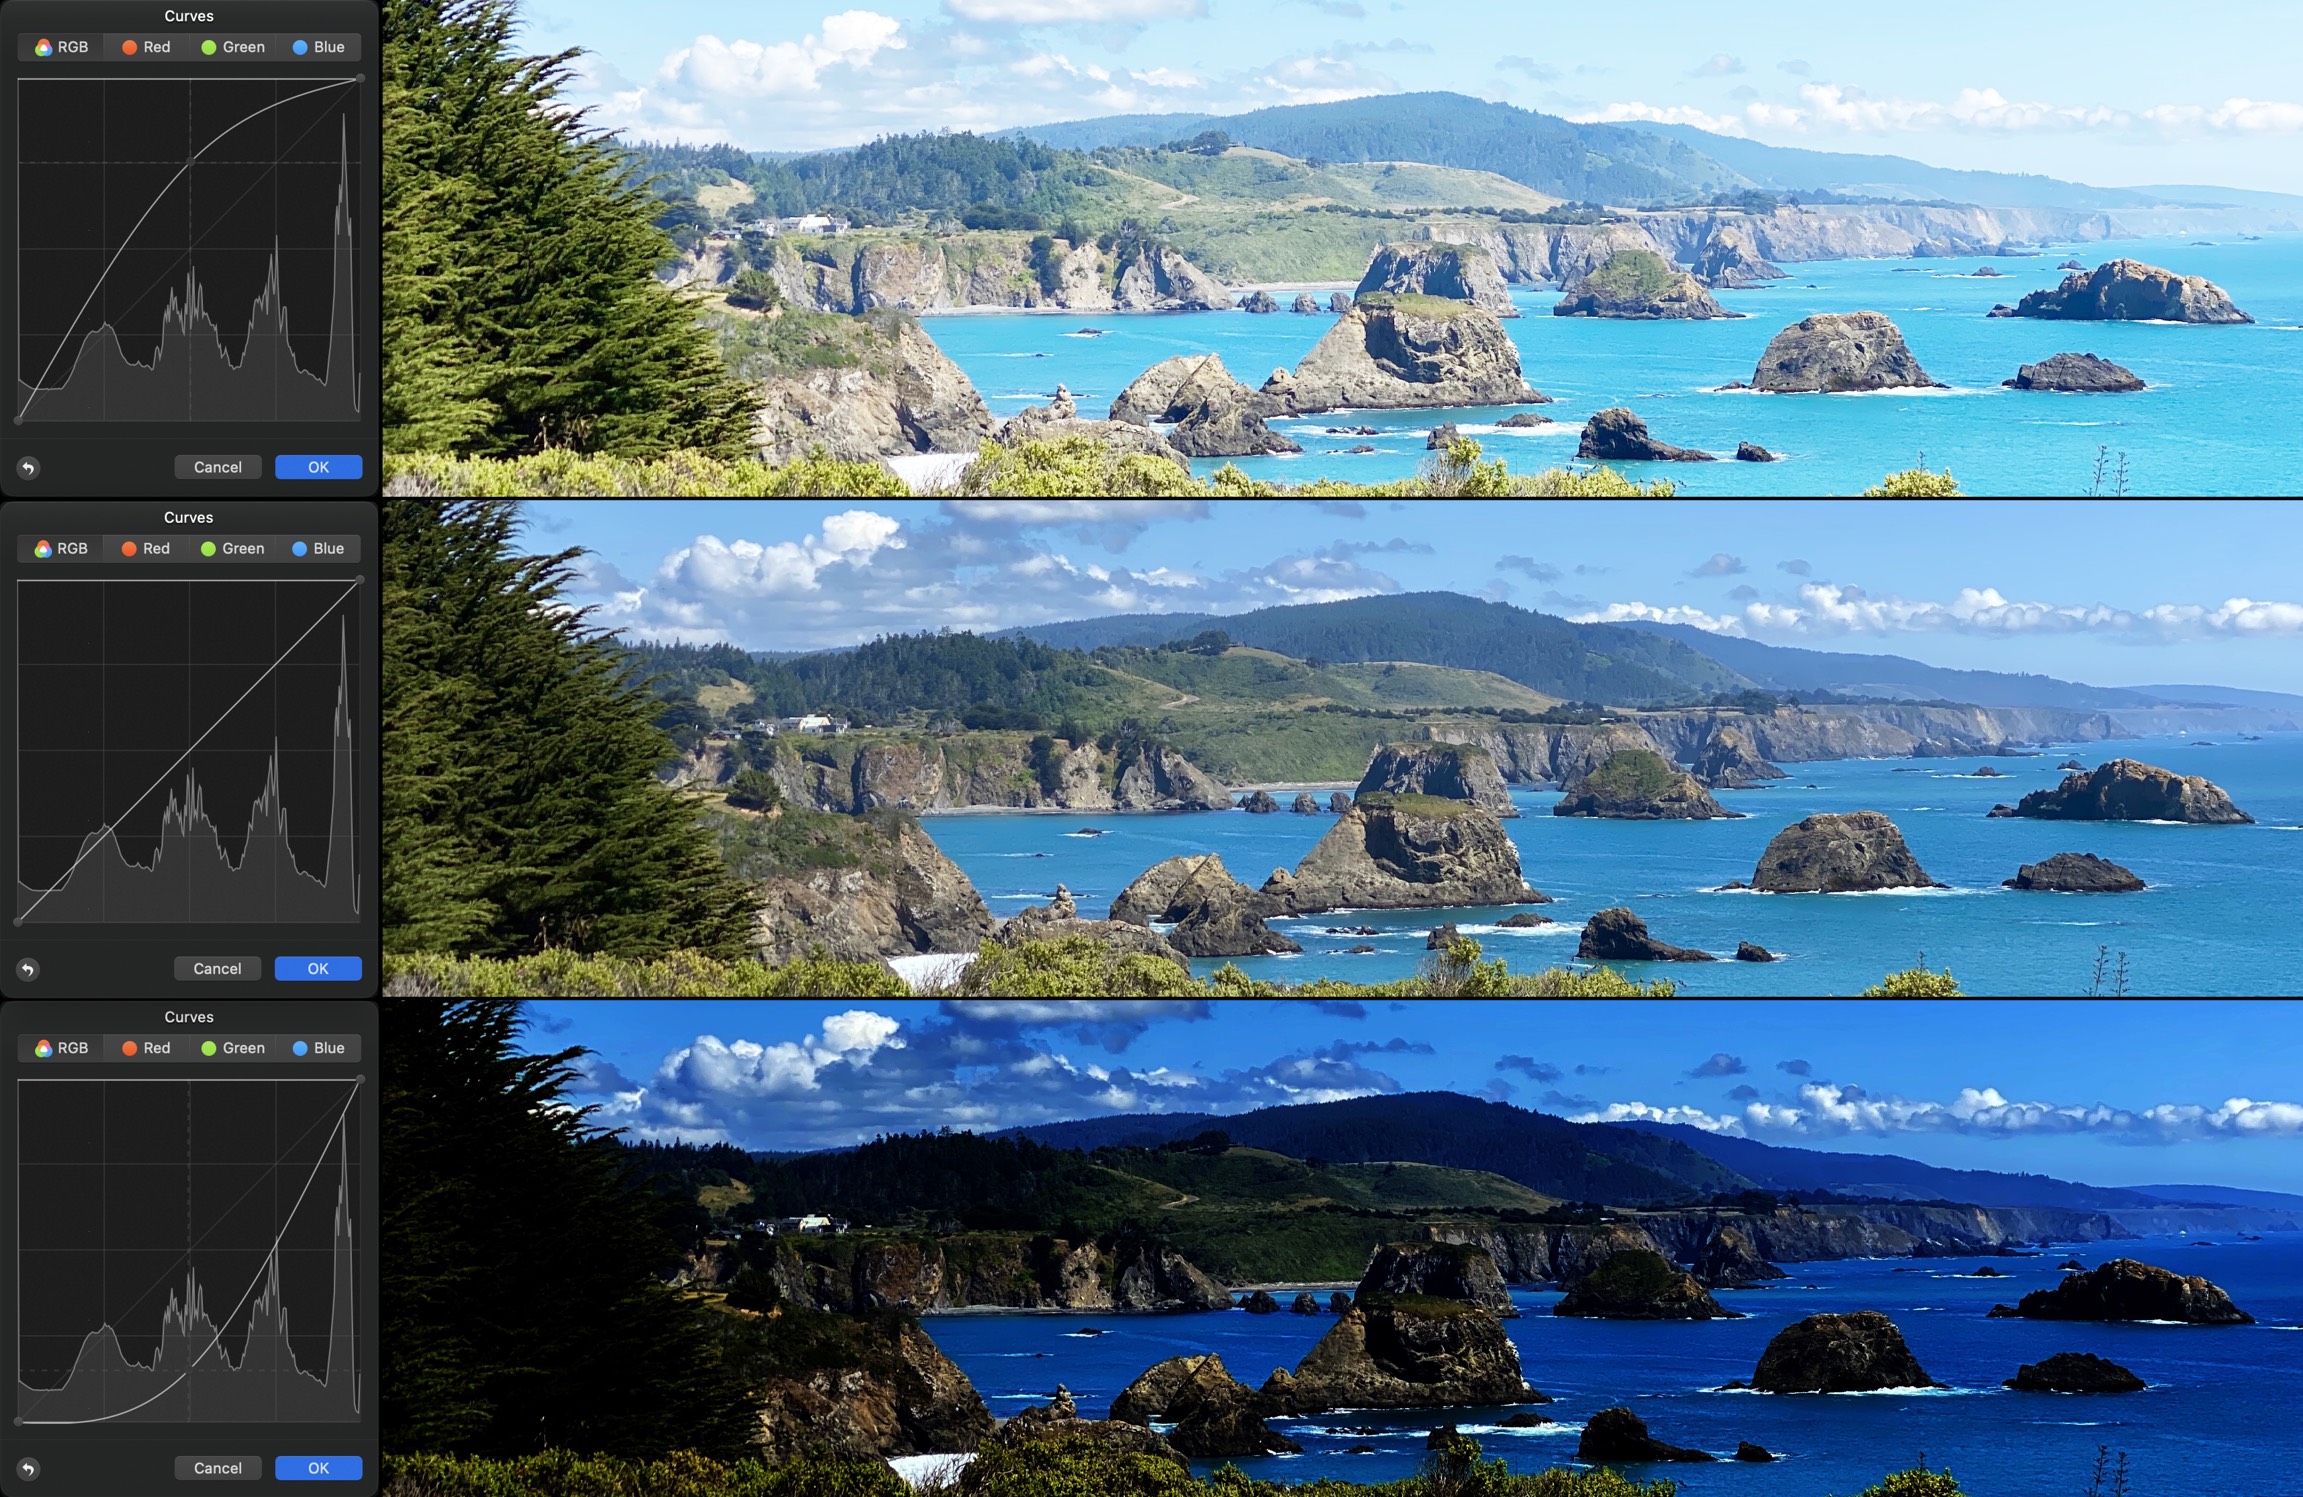
The idea is that you can add as many points as you like, and the photo editing app draws a curve connecting them. Those interpolated values are then applied to the image as channel value adjustments. In the above examples the same curve is applied to all the color channels, but you can apply different curves to each channel if you want.
In this tutorial, we’ll explore how curves work mathematically, and how to implement them in JavaScript with the HTML5 Canvas.
Starting Out
Let's start with the basics. As it turns out, applying a curve is actually a really simple operation. All you need is an array of 256 numbers representing the curve values, to use as a sort of "lookup table" for each pixel channel value. So for each pixel, take the red, green and blue channel values, and look up the corresponding "adjusted" value in the table:
| Original Color | Red Lookup | Green Lookup | Blue Lookup | Final Color |
|---|---|---|---|---|
| RGB(0,107,188) | 0 → 0 | 107 → 211 | 188 → 243 | RGB(0,211,243) |
| RGB(0,170,112) | 0 → 0 | 170 → 239 | 112 → 216 | RGB(0,239,216) |
| RGB(190,132,18) | 190 → 243 | 132 → 228 | 18 → 35 | RGB(243,228,35) |
| RGB(191,51,72) | 191 → 243 | 51 → 108 | 72 → 153 | RGB(243,108,153) |
| RGB(89,69,156) | 89 → 185 | 69 → 147 | 156 → 236 | RGB(185,147,236) |
| RGB(47,60,135) | 47 → 99 | 60 → 128 | 135 → 229 | RGB(99,128,229) |
| RGB(57,131,60) | 57 → 121 | 131 → 228 | 60 → 128 | RGB(121,228,128) |
| RGB(63,82,91) | 63 → 134 | 82 → 172 | 91 → 188 | RGB(134,172,188) |
| RGB(159,61,82) | 159 → 237 | 61 → 130 | 82 → 172 | RGB(237,130,172) |
| RGB(123,113,104) | 123 → 225 | 113 → 217 | 104 → 207 | RGB(225,217,207) |
| RGB(149,183,75) | 149 → 234 | 183 → 242 | 75 → 159 | RGB(234,242,159) |
| RGB(96,159,187) | 96 → 196 | 159 → 237 | 187 → 243 | RGB(196,237,243) |
| RGB(32,108,107) | 32 → 65 | 108 → 212 | 107 → 211 | RGB(65,212,211) |
| RGB(186,122,123) | 186 → 242 | 122 → 224 | 123 → 225 | RGB(242,224,225) |
| RGB(108,178,94) | 108 → 212 | 178 → 241 | 94 → 193 | RGB(212,241,193) |
| RGB(187,51,50) | 187 → 243 | 51 → 108 | 50 → 106 | RGB(243,108,106) |
So this really just becomes a simple for loop iterating over each pixel and updating the channel values:
let curve = new Array(256); // assume this is populated elsewhere
let canvas = document.querySelector('canvas');
let context = canvas.getContext('2d');
let { width, height } = canvas;
let imgData = context.getImageData(0, 0, width, height);
let offset = 0;

for (let y = 0; y < height; y++) {
    for (let x = 0; x < width; x++) {
        imgData.data[ offset + 0 ] = curve[ imgData.data[ offset + 0 ] ];
        imgData.data[ offset + 1 ] = curve[ imgData.data[ offset + 1 ] ];
        imgData.data[ offset + 2 ] = curve[ imgData.data[ offset + 2 ] ];
        offset += 4;
    } // x loop
} // y loop

context.putImageData( imgData, 0, 0 );
The tricky part is actually how you generate the curve that you apply to the pixel values. Anyone can throw some numbers into an array, but how do you generate a nice, smooth curve between multiple points like Photoshop and Pixelmator do? Well, after some research, it turns out this is called monotone cubic interpolation, and Wikipedia even provides some sample JavaScript to generate one! How convenient!
So, we need to create an "interpolant" function by feeding it our desired points, and then it generates a curve into our final array. Once we have the array, we can use code like the above example to render it onto a canvas. Here is some pseudocode to illustrate the setup:
// simple 3-point curve brightening midtones
let points = [
    [0, 0],
    [127, 192],
    [255, 255]
];

// create interpolant function (from wikipedia)
let func = createInterpolant(points);

// generate our 256-element curve array
let curve = [];

for (x = 0; x < 256; x++) {
    let y = func(x);
    curve.push( Math.floor(y) );
}
The idea here is that we describe our desired curve using points, each as an X/Y pair. In this example we have 3 points, with the middle point being "elevated" beyond where it would normally fall for a flat ramp. For reference, a totally neutral (flat) curve would look like this:
let points = [
    [0, 0],
    [255, 255]
];
This would result in an array that simply progressed linearly from 0 to 255 without curvature, and would be a "no-op" if applied to an image (no pixels would change). But in our example above, we have a 3rd point in the middle, which is right on the X midpoint (127), but the Y value is 192:
let points = [
    [0, 0],
    [127, 192], // this one
    [255, 255]
];
So the generated curve in this case would elevate the midtones in the image.
The "magic" happens inside the interpolant function. We pass our desired points to createInterpolant() (which is adapted from Wikipedia's sample code), and it generates a function we can call for every X value in the final 256-element array. The generated function returns all the necessary Y values to complete the curve.
Examples
So, putting everything together, I wrote a little library to generate curves based on any number of points, and render them on to a canvas. Here is a live, interactive demo. Click the "" icon to add points, and "" to remove them. Click and drag each point up or down to see the result.
Cool, right? As you can see, the interpolant function creates a smooth transition between all the points, resulting in a "curve", hence the name.
But wait, it gets way more interesting.
Curves can be used to apply many of the standard image filters you see in photo editing apps. Want to adjust the image Brightness? It's just a curve! In fact, that is a simple two-point curve (i.e. a straight line that just changes its angle). Take a look:
Brightness is the most straightforward example of how a curve can alter an image. The curve here is just a straight line connecting two points, but if you slide those points upward, every input value gets mapped to a slightly higher output value. That means even the darkest pixels shift toward gray, making the entire image lighter. Pull the line downward, and the opposite happens — all values shift lower, and the whole image darkens. What’s important to notice is that the shape of the line never changes: it’s still perfectly straight, so contrast and tonal balance remain intact. Only the overall “baseline” of brightness moves.
Another fun thing to try is toggling the "R", "G" and "B" controls above. These control which color channels the curve is applied to. Try turning off all but one channel, and increasing or decreasing the brightness. Cool, right?
Here is the code for generating the brightness curve. As you can see it's very simple:
// start with a two-point flat curve
let curve = [ [0,0], [255,255] ];

if (opts.amount > 0) {
    // increase brightness by raising the left point
    curve[0][1] += opts.amount;
}
else {
    // decrease brightness by lowering the right point
    curve[1][1] += opts.amount;
}

// clamp values to 0-255
for (let idx = 0, len = curve.length; idx < len; idx++) {
    curve[idx][1] = Math.max(0, Math.min(255, curve[idx][1]) );
}
But hold on a minute, what about Contrast Adjustment? That's much more complicated, right? Nope, it's also just a curve! It is just constructed a little differently. Let's take a look at how that works:
Isn't that neat? Contrast works by stretching or compressing the slope of the curve. Imagine taking the straight diagonal line of a neutral curve and pivoting it around its center. Tilt it steeper and the differences between light and dark pixels widen: shadows fall to pure black, highlights push toward white, and midtones separate more clearly. Tilt it flatter and the opposite happens — the differences between tones compress, shadows wash out to gray, highlights lose their sparkle, and the image looks “flat.” So contrast isn’t about moving the curve up or down, it’s about changing its angle of attack across the tonal range. Here is the code for contrast:
// start with a two-point flat curve
let curve = [ [0,0], [255,255] ];
opts.amount = Math.floor( opts.amount / 2 );

if (opts.amount > 0) {
    // increase contrast
    curve = [ [0,0], [opts.amount, 0], [255 - opts.amount, 255], [255,255] ];
    opts.algo = 'linear';
}
else {
    // decrease contrast
    curve[0][1] -= opts.amount;
    curve[1][1] += opts.amount;
}

// clamp values
for (let idx = 0, len = curve.length; idx < len; idx++) {
    curve[idx][1] = Math.max(0, Math.min(255, curve[idx][1]) );
}
Now check this out. Let's combine both the brightness and contrast filters, and you can see how each affects the computed curve:
So adjusting the contrast is basically just "rotating" the two points, while brightness moves them up and down vertically. We just implemented a Photoshop-style brightness and contrast filter, using only curves!
But it gets even more crazy...
What about adjusting things like shadows, midtones, and highlights? Most photo editing apps offer those controls nowadays. I'm telling you, it's all curves! All three of those filters are just different, specially crafted curves. Check it out -- try these sliders:
Try sliding the shadows slider to the right, and watch the trees. See all that detail come out? Fascinating, right?
Shadows, midtones, and highlights sliders are really just pre-packaged curve manipulations targeted to specific regions of the tonal spectrum. Midtones lift or sink the center of the curve, gently brightening or darkening the “middle grays” without touching pure black or white. Shadows introduce a bend near the left edge of the curve: instead of crushing all dark values together, they’re pulled apart more steeply, so faint details emerge in the darker regions of the image. Highlights do the same at the right edge, spreading out the brightest values so cloud textures or shiny reflections aren’t lost. What looks like “magic recovery” of detail is just a smarter redistribution of tonal values along the curve. Here is the code for both shadows and highlights (they are applied together):
// start with a 4-point curve
let curve = [ [0,0], [63,63], [191,191], [255,255] ];

// shadows
if (opts.shadows) {
    curve[1][1] += opts.shadows;
}

// highlights
if (opts.highlights) {
    curve[2][1] += opts.highlights;
}

// clamp values
for (let idx = 0, len = curve.length; idx < len; idx++) {
    curve[idx][1] = Math.max(0, Math.min(255, curve[idx][1]) );
}
Isn't that insanely simple? Adjusting the shadow detail is literally just moving the 2nd curve point (the one at index 63) up or down. And likewise, the highlight adjustment is just moving the 3rd curve point (at index 191) up or down. My mind was blown after learning this. Oh, and midtones is applied as a separate 3-point curve, where we simply move the center point up/down:
// start with 3-point curve
let curve = [ [0,0], [127,127], [255,255] ];

// midtones
curve[1][1] += opts.amount || 0;

// clamp values
for (let idx = 0, len = curve.length; idx < len; idx++) {
    curve[idx][1] = Math.max(0, Math.min(255, curve[idx][1]) );
}
What about producing a Photographic Negative of the image? Yup, a curve:
This one is easy, because the values are simply flipped: what was once black (0) becomes white (255), and what was white becomes black. Every intermediate value is mirrored across the center, so midtones remain midtones but swap their polarity. Because all three channels are inverted independently, colors reverse too — blues turn to yellows, reds to cyans, greens to magentas. The effect feels dramatic, but it’s really just the most extreme example of re-mapping input to output values. The code:
// build inversion curve
let curve = [];
let amount = opts.amount / 100;

for (let idx = 0; idx < 256; idx++) {
    curve.push( Math.floor( idx + (((255 - idx) - idx) * amount) ) );
}
What about something more complex like the Solarize Filter? It's also a curve! This one is simply an upside-down "V" curve. Slide to see:
Solarization is one of the stranger effects, because the curve no longer monotonically increases — it climbs up, then descends. That means some input brightness values get mapped to lower outputs than darker pixels before them. The result is a dramatic reversal where mid-tones flip polarity, creating that surreal glowing look you may recognize from darkroom experiments. It shows that a curve doesn’t have to be “one direction only.” As long as you define the mapping, the image will obey, even if it means light pixels suddenly turn dark and vice versa. The code:
// build solarize curve
let curve = [];
let amount = opts.amount / 100;

for (let idx = 0; idx < 256; idx++) {
    curve.push( (idx < 128) ? idx : Math.floor( idx + (((255 - idx) - idx) * amount) ) );
}
As you can see, the solarize code is very close to invert. The only difference is that it only inverts values over 127. The darker values are untouched. Simple!
Okay, fine, but what about the popular Posterize Filter? It's also a curve! This one uses a stair-step curve shape. Check it out:
Posterization demonstrates that curves don’t need to be smooth. A stair-step curve flattens wide ranges of input values to a single output level. Instead of a continuous gradient of tones, you get abrupt jumps — flat bands of color separated by sharp edges. The higher the step count, the more levels survive; the fewer the steps, the harsher the cartoon-like effect. This is a perfect example of how the curve is really just a lookup table: nothing forces it to be curvy. It can be jagged, stepped, or even completely flat. The posterize code:
// build posterize curve
let levels = Math.floor( 256 / (opts.levels || 4) );
let curve = [];

for (let idx = 0; idx < 256; idx++) {
    curve.push( Math.min(255, Math.round( idx / levels ) * levels) );
}
Isn't this cool? Posterize is basically just "quantizing" values into buckets by dividing the value by the amount. And the fun keeps going... you know the Threshold Filter? You're not going to believe this, but... it's also a curve!
The threshold filter takes the posterize idea to its extreme: the curve collapses the entire tonal range into just two levels. Also, all color values are typically averaged, resulting in a totally black & white image. Everything below the threshold value maps to black, and everything above it maps to white. The result is a stark, high-contrast silhouette that strips away all midtones. This makes fine detail disappear, but it also emphasizes shape and outline, which is why thresholding is often used for image analysis, masks, or artistic stencil effects. Here is the threshold code:
// build threshold curve
let level = Math.floor( opts.level || 0 );
let curve = [];

for (let idx = 0; idx < 256; idx++) {
    curve.push( (idx < level) ? 0 : 255 );
}
Now wait, what about filters that change the actual color of the image? Like Color Temperature? Curves can do that too!
Color temperature adjustment demonstrates the power of applying curves to individual channels. By tilting the red curve upward and the blue curve downward (or vice versa), you warm or cool the entire image. A warmer curve emphasizes reds and oranges, giving sunsets or skin tones a golden glow. A cooler curve boosts blues, shifting daylight toward a more icy, fluorescent look. The green channel often stays neutral, acting as an anchor. Because each channel is just another set of 256 values, manipulating them separately lets you rebalance the perceived “white point” of the photo. Here is the code:
// start with 3-point curve
let curve = [0, 127, 255];
let channel = '';
let amount = 0;

if (opts.amount > 0) {
    // warmer
    channel = 'red';
    amount = Math.floor(opts.amount / 4);
}
else {
    // cooler
    channel = 'blue';
    amount = 0 - Math.floor(opts.amount / 4);
}

// adjust midpoint and clamp
curve[1] = Math.min(255, Math.max(0, curve[1] + amount));

// apply to channel-specific curve
delete opts.amount;
opts[channel] = curve;
Here's another multi-channel example: Sepia Tone -- and yup, it's a curve too:
Sepia tone is essentially a selective color remapping achieved with curves. After converting the image to grayscale (or desaturating it), a sepia curve pushes the darker values toward rich browns and the lighter values toward soft yellows. The result mimics the chemical processes of early photography, where images faded into warm, earthy hues. What makes this interesting is that you don’t need special math for sepia — you simply apply a color-tinted curve across channels to bias grays into a brownish spectrum. Here is the code:
let amount = opts.amount / 100;

// 3-point green curve
opts.green = [0, Math.floor(127 - (amount * 19)), 255];

// 3-point blue curve
opts.blue = [0, Math.floor(127 - (amount * 63)), 255];
There are plenty of other examples too:
How about Gamma Correction? Also a curve!
Gamma correction applies an exponential adjustment, and the curve makes this relationship visible. A gamma curve is concave or convex depending on whether you’re raising or lowering the exponent. Increase gamma and the curve bends upward, lifting shadows and compressing highlights; decrease it and the curve bends downward, darkening shadows while preserving bright areas. Unlike brightness or contrast, which shift or rotate the curve linearly, gamma re-shapes the middle of the curve in a mathematically smooth way. That’s why gamma is so often used for calibration — it redistributes tonal values without clipping the extremes. Here is the code for the gamma curve:
// build gamma curve
let curve = [];
let gamma = opts.amount || 1;

for (let idx = 0; idx < 256; idx++) {
    curve.push( Math.floor( Math.clamp(255 * Math.pow((idx / 255), gamma), 0, 255) ) );
}
Okay fine, what about Exposure Adjustment? Curves can do that!
Exposure adjustment is modeled on how much light actually hits film or a sensor, and in curve terms it’s a uniform expansion or contraction of the tonal range. Sliding the exposure up shifts the curve so that values are multiplied, brightening the entire image but with emphasis on the higher values. Slide it down and the curve compresses, darkening everything with an inverse emphasis on the darker values. This multiplication can push tones toward clipping -- but this makes it feel more “photographic” because they can "blow out" the image and max out the values, simulating what happens if you open or close a camera’s aperture. Here is the code:
// define a 5-point straight curve to start
let curve = [ 0, 63, 127, 191, 255 ];

// apply exposure as multiplications on curve points
if (opts.amount) {
    if (opts.amount > 0) {
        // increase exposure -- emphasis on lighter values
        curve[1] += (opts.amount * 2);
        curve[2] += (opts.amount * 3);
        curve[3] += (opts.amount * 4);
    }
    else {
        // decrease exposure -- emphasis on darker values
        opts.amount /= 2;
        curve[4] += (opts.amount * 5);
        curve[3] += (opts.amount * 4);
        curve[2] += (opts.amount * 3);
        curve[1] += (opts.amount * 2);
    }
}

// clamp values
for (let idx = 0, len = curve.length; idx < len; idx++) {
    curve[idx] = Math.max(0, Math.min(255, curve[idx]) );
}
Okay wait, what about the magical Auto-Enhance Filter that most photo apps offer nowadays. You know, the one that automatically corrects brightness, contrast and white-balance by analyzing the image? Yes, curves can do that too!
Auto-enhance works by analyzing the histogram of the image — essentially a count of how many pixels fall into each brightness bin. If the darkest pixel isn’t near zero, or the brightest isn’t near 255, the curve is stretched so the full tonal range is used. In practice, that means the curve pulls shadows down to black and pushes highlights up to white, redistributing everything in between. The result often looks like an instant “pop”: more contrast, richer colors, and better balance, especially in hazy or underexposed photos. It’s still just a curve, but one generated automatically based on the content of the image.
Isn't it just amazing? I'm telling you, everything is curves!
To be fair here, auto-enhance does involve taking a histogram of the image, finding the darkest and lightest points for each color channel, and then "extending" the contrast (using a curve!) so the darkest point meets black, and the whitest point meets white. So it does involve "more" than just curves, but I think it still qualifies.
Summary
What makes curves so compelling is their universality. With the same underlying mechanism — a mapping from 0–255 input values to 0–255 outputs — you can recreate a wide range of effects: brightness, contrast, gamma, exposure, color balance, and even artistic transformations like solarize or posterize. Whether the curve is linear, stepped, or smoothly interpolated, the principle is always the same: each pixel’s channel value is passed through a lookup table defined by the curve.
If you’d like to explore further, the library which powers the demos in this article are available as open source on GitHub: pixl-curves. For a broader toolkit that includes curves along with many other filters, see my canvas-plus library, which extends the HTML5 Canvas API for both browsers and Node.js.
I hope you enjoyed this journey into curve world, and learned something along the way. I had a ton of fun writing this article.
Have a great day!